


 Minicore®3
MiniCore®3 inclut en standard un carrousel à 8 positions pour vous permettre d’utiliser simultanément jusqu’à 7 blocs donneur et ainsi de sauver encore du temps et vous faciliter votre tâche.
La sélection des zones de carottage dans les blocs donneur est réalisée par dessin de zone ou pointage, directement à l’écran sur l’image du bloc donneur superposée avec celle de la lame de contrôle H&E
L’interface logicielle MiniCore®3 Control Station affiche toutes les informations en temps réel. En cas de difficultés sur un bloc donneur, l’utilisateur peut aisément changer de bloc et continuer son tissue array, sans perte de qualité.
Minicore®4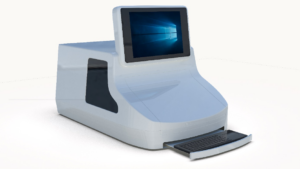
Le Tissue Arrayer Automatique MiniCore®4 est conçu pour rendre simple, rapide et précis la construction de blocs de tissue arrays de haute densité.
MiniCore®4 inclut un plateau à 20 positions qui autorise l’utilisateur à construire jusqu’à 4 blocs receveur et de disposer jusqu’à 16 blocs donneur par run.
Minicore® propose une gamme complète d’aiguille allant de 0.6 mm à 2 mm.
Le système est équipé d’un PC embarqué avec écran tactile.
L’interface logicielle MiniCore®4 affiche toutes les informations en temps réel. La sélection des zones de carottage dans les blocs donneur est réalisée directement à l’écran sur l’image du bloc donneur superposée automatiquement par intelligence artificielle avec celle de la lame de contrôle H&E.
Easy TMA Creator
Grâce à notre logiciel de construction de TMA, vous pouvez concevoir tous types de format à partir d’une liste sous format Excel® d’identifiants de spécimens.
Lors de la construction, le MiniCore® 3 exploite automatiquement le fichier de configuration de votre tissue array. Les erreurs de position sont virtuellement éliminées.
A chaque fois qu’un bloc donneur est requis, l’identifiant de celui-ci s’affiche à l’écran. Les erreurs de spécimens sont fortement réduites.
Enfin, chaque étape est enregistrée dans un fichier log afin de garantir une parfaite traçabilité.
Jeux d’aiguilles de carottage SpotBrowser® 4
Spot identification is undoubtedly the most time-consuming and difficult stage in preparing tissue array spots for analysis. Identification includes detecting spots on the slide scan, then associating each of these spots with their respective position in the initial plan of your Arrays tissue, to create the essential traceability link between spot and patient data.
Spot Browser® 4 includes a de-Arraying tool for data detection and association. Simply import your tissue array map file, and Spot Browser® 4 takes care of the rest. Interactions and corrections are always possible in cases where the Tissue Array is truly in poor condition on the blade (severe deformations).
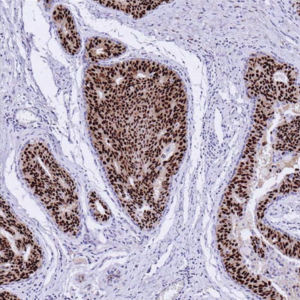
Annotation on tissue array spots
In many cases, spots are “scored” visually, because the pathologist’s expert eye cannot so easily be replaced by software, however powerful.
To meet this need, Spot Browser® 4 allows users to create their own data fields in various formats (free, numeric, drop-down list…) to enter their annotations. The user can quickly navigate from one spot to another and enter annotations.
Input and imported data can be exported in Excel format for statistical processing.
Automatic analysis of tissue array spots
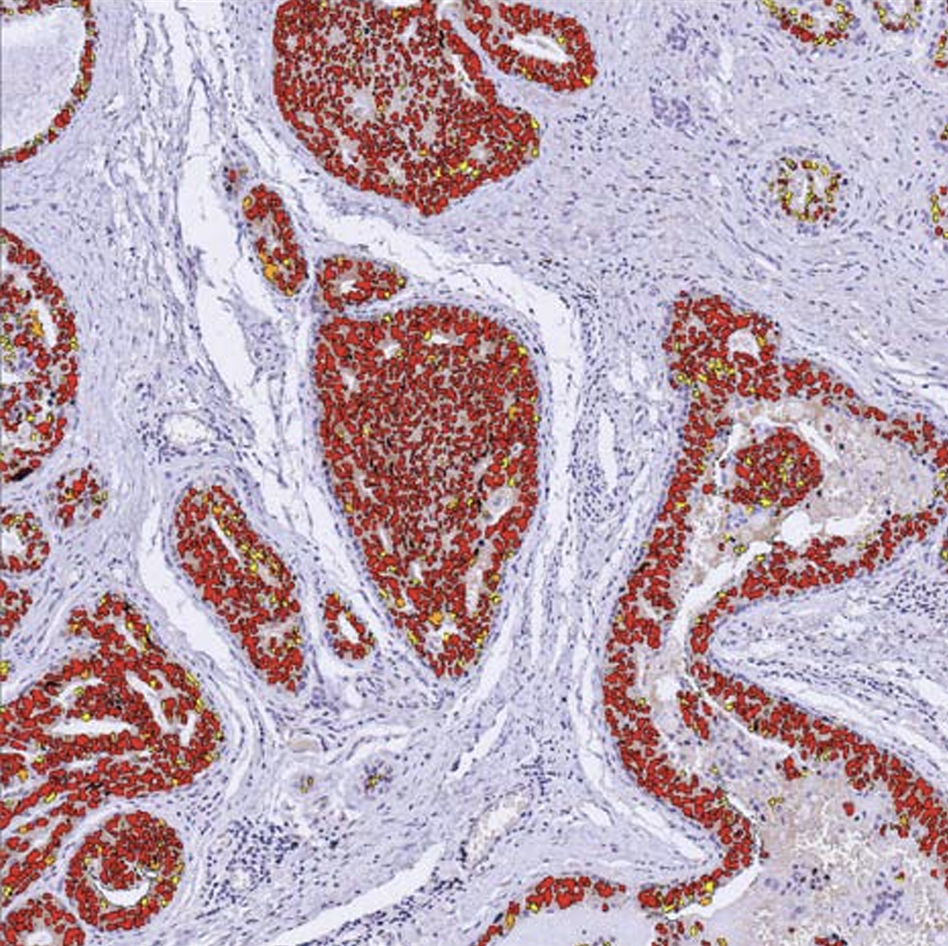
For analysis of large numbers of spots or for quantitative analysis, Spot Browser® 4 offers a comprehensive tool for automatic image analysis.
HSV color and morphometry are the characteristics used. Each of these features can be used alone or in combination, depending on the objects to be detected.
Users can easily create their own detection protocols, with one or more types of object to be detected, and with or without nesting, for example, to count labeled nuclei in a tumor zone. Cytoplasmic and membrane labelling can also be detected.
Detection and analysis protocols can be saved in internal libraries for future use.
The user can analyze spots one by one or in automatic batch mode, and analyses can combine human intervention (zone tracing, for example) with fully automatic modes.
Raw and interpreted results can be exported to Excel.
SnapFrost®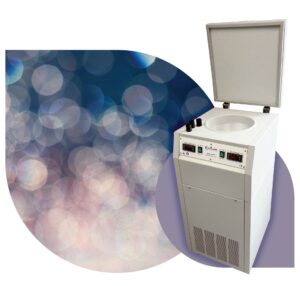 SnapFrost® guarantees ultra-fast, reproducible freezing of your samples.
The reference technique using Iso pentane refrigerated down to -80°C, which unlike liquid nitrogen does not degas, enables rapid, reproducible temperature transmission to the sample.
Molecular content does not diffuse into the sample, cell membranes are preserved and tissue damage is avoided.
Ergonomic and flexible in use, SnapFrost® features two individually controllable freezing chambers to suit all freezing protocols and tissue types. The volume of the lower chamber containing Iso pentane can be modulated (from 5 to 680 ml) to suit all sample sizes.
Alternative solutions such as the Novec 7100 can also be used in the SnapFrost®, retaining the advantages of the appliance and guaranteeing high quality freezing.
Programmable, compact and autonomous, SnapFrost® can be moved to different freezing zones, guaranteeing flexibility, time savings, safety, quality and reproducibility in your freezing operations.
Process Record SlidesTraditional tissue controls have long been the norm in immunohistochemistry but they have limitations: lack of standardization, variability from one batch to another, and risk of misuse. PRS slides revolutionize immunohistochemistry by replacing these tissue controls.
Standardizing the IHC staining process using the PRS tool offers several advantages in antibody validation:
Quantitative assessment: The predetermined quantification of the surrogate antigens enables quantitative assessment of the intensity of the staining, thus facilitating the objective assessment of the performance of the antibodies used.
Quality control: The PRS tool serves as a quality control measure, allowing users to verify the reliability and consistency of antibody staining between different batches and experiments.
Error detection: Deviations between the observed staining pattern and the expected result based on the PRS tool indicate potential errors in antibody selection or application, prompting further investigation and corrective action.
Workflow efficiency: Standardization of the staining process streamlines workflow procedures, reduces variability, and optimizes laboratory efficiency in IHC testing; there is more control tissue pattern to be deposited on the slide in addition to the tissue to be tested
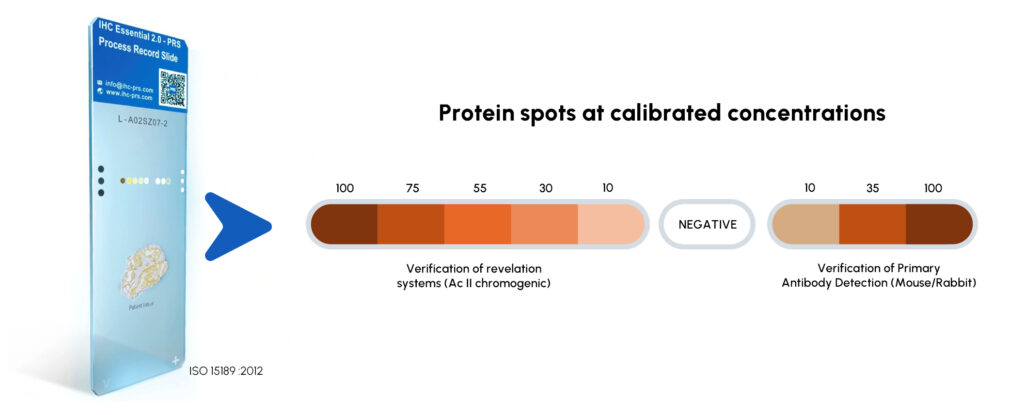
PRS eliminates false negative/positive staining results through 100% slide control; each IHC slide is assessed individually.
PRS makes it possible to do away with expensive off-the-shelf control blocks.
PRS ensures accurate and consistent results while complying with ISO 15189 standards. Primary and secondary protein targets with certified antigen expression levels are recognized as an ISO 13485 medical device. PRS helps in achieving accreditation and regulatory compliance with ISO15189, CLIA and ACP standards.